Viewing an Application
Using Volt MX Engagement services Console, you can view statistics for individual apps.
To view statistics for an app, follow these steps:
-
Click the desired app on the Apps home page.
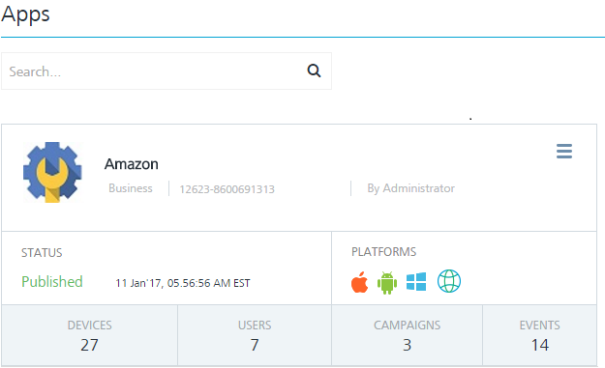
The App Details page opens with two tabs: Analytics and Settings. By default, the Analytics tab is set to active.

Under the Analytics tab you can view an individual app's statistics to understand multiple aspects of your application:
- Total Devices: The label displays the total number of devices on which the app is installed.
- Total Users: The label displays the total number of users who use the app.
- Total Campaigns: The label displays the total number of campaigns associated with the app.
- Total Events: The label displays the total number of events associated with the app.
Reports
Under the Usage and the Messages Sent vs. Open sections, you can view types of reports. The reports helps you view push notification’s performance and make appropriate decisions.
To view App reports, follow these steps:
-
Hover the cursor over a block in the graph to view additional information such as Pushes Sent: 82.
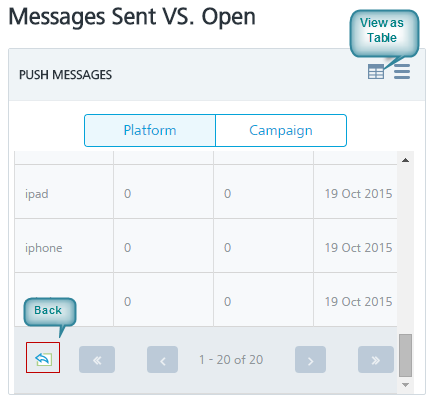
-
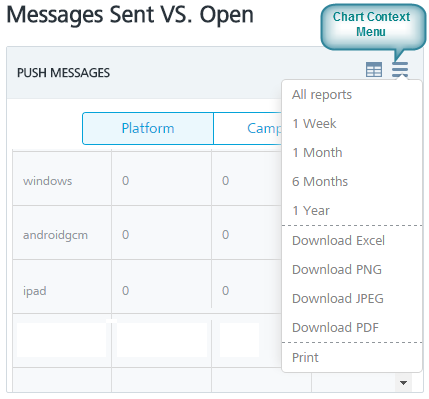
Click the view as table icon at the upper right corner of the chart to view the report in a table format. Click the back icon to view charts in the graphical format.
-
Click the chart context menu icon at the top right corner of the chart to generate reports with various options.
Usage
The Usage section displays the following reports:
- Daily Subscribers - Existing
- Daily Subscribers - New
- User per Location - US
- Users per Location - World
- Device per Platform
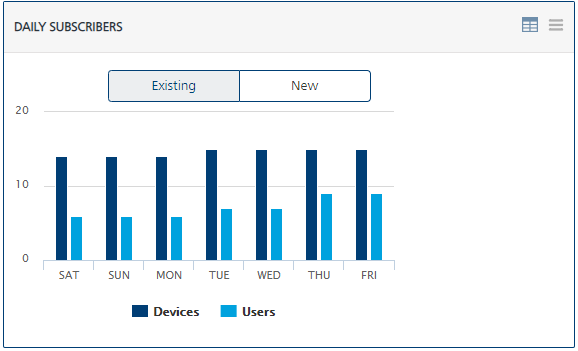
Daily Subscribers - Existing
The Daily Subscribers- Existing chart provides the total number of the existing Subscribers (devices and users) for the particular application since Volt MX Engagement services console is configured and used on your system. The chart shows the Subscribers (devices and users) for the last seven days.
Based on your requirement, you can customize the report through the chart context menu icon.
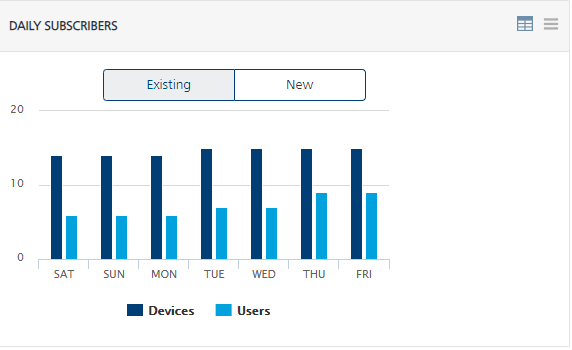
Daily Subscribers - New
The Daily Subscribers - New chart provides the total number of the new Subscribers ( devices and users) in the system since Volt MX Engagement services console is configured and used on your system. By default, the report displays new Subscribers (devices and users) for a week.
Based on your requirement, you can customize the report through the chart context menu icon.
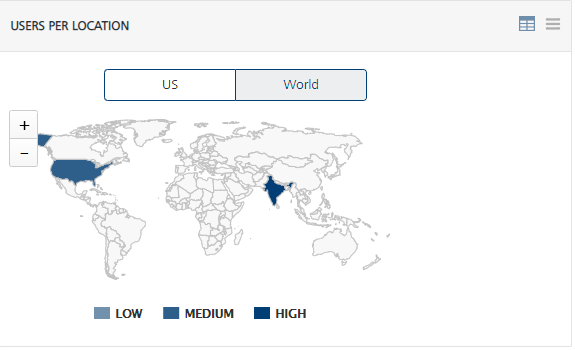
User per Location - US
The User per Location - US chart provides data about where in the U.S. the users are located for a particular application. The chart also provides a map of the users at various locations in USA.
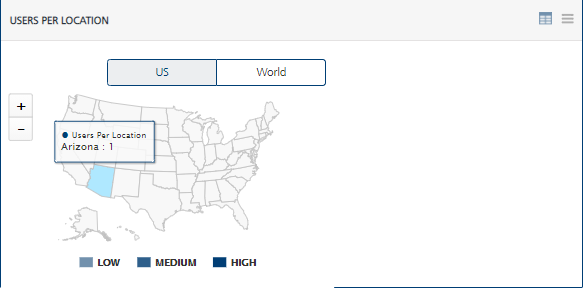
Users per Location - World
The Users per Location - World chart provides data about users spread across countries for a particular application. Based on your requirement, you can customize the report through the chart context menu icon.
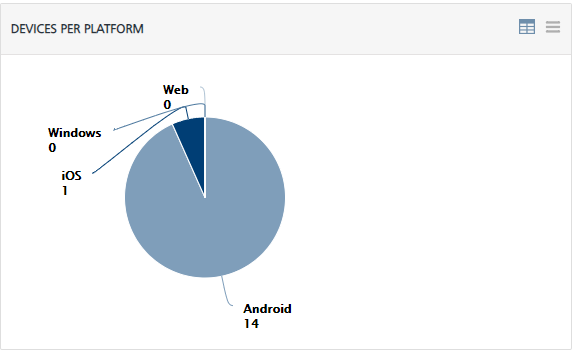
Device per Platform
The Device per Platform chart provides data about the relative number of devices running under the different platforms and have the particular application installed.
Messages Sent vs. Open
The Messages Sent vs. Open section displays the following reports:
- Messages Sent versus Opened – Platform Level
- Messages Sent versus Opened – Campaign Level
- Total Messages
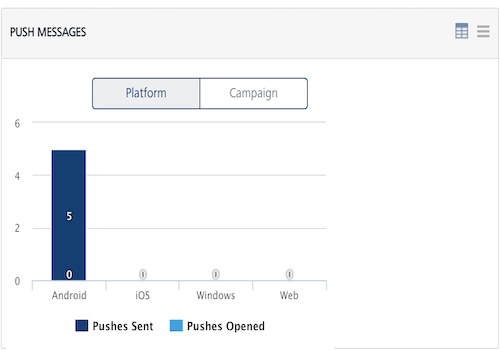
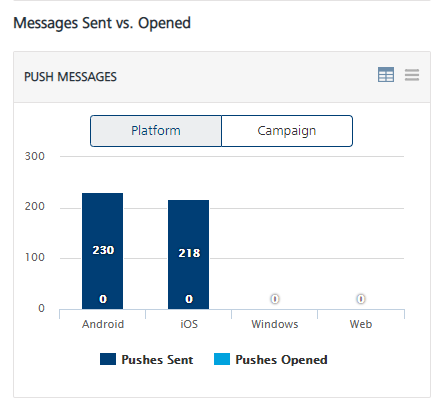
Messages Sent versus Opened – Platform
The Messages Sent versus Opened at Platform chart displays the number of push notifications sent and push notifications opened per platform for the particular application since Volt MX Engagement services console is configured and used on your system.
In this chart, the X axis represents all the current platforms, and the Y axis represents the total number of push messages.
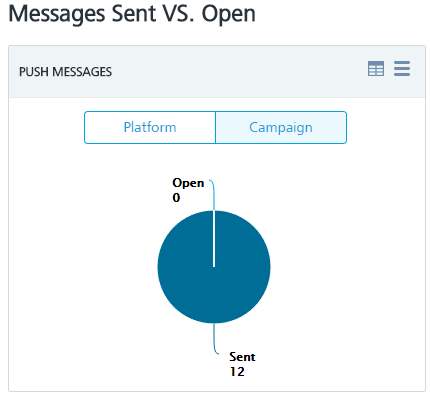
Messages Sent versus Opened – Campaign
The Pushes sent versus Opened at Campaign chart displays the number of push messages sent and push messages opened for all the campaigns associated with the application since Volt MX Engagement services console is configured and used on your system.
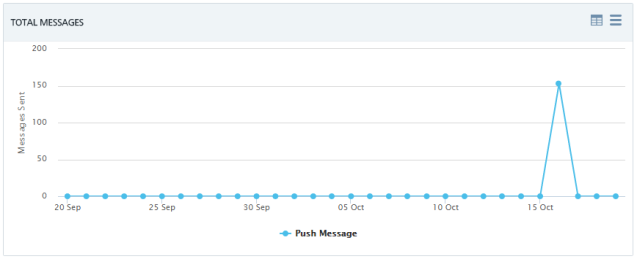
Total Messages
The Total Messages graph shows the total number of the push messages sent and push messages opened over the last 30 days for the particular application since Volt MX Engagement services console is configured and used on your system.