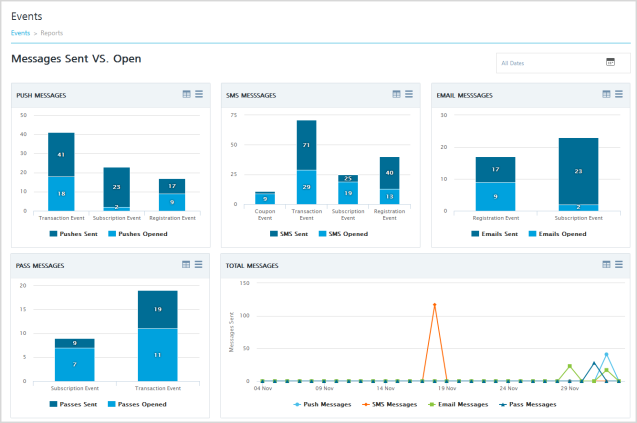
Viewing Events Reports
Click the Reports button on the Events home page to view event reports. On the Events Reports page, you can see the number of event messages sent versus opened for all the configured channels, since the Engagement services console is configured and used.
To view event reports, follow these steps:
- Under Engagement, click Events.
-
On the Events page, click the Reports button.
The system displays the Events Reports page with all the reports under the Messages Sent Vs. Open header. You can view the following event reports:
Push Messages
The Push Messages Sent versus Opened graph shows the number of pushes sent and the number of pushes opened for the events. The default view shows the total number of pushes sent versus opened for the events since Engagement services console is configured and used.
For example, the subscription push event messages in the following graph show that over a period of 20 days, the system sent 23 push messages, and the user opened two push messages.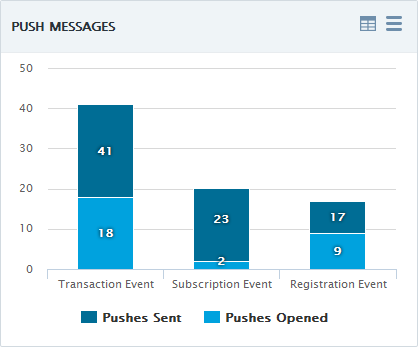
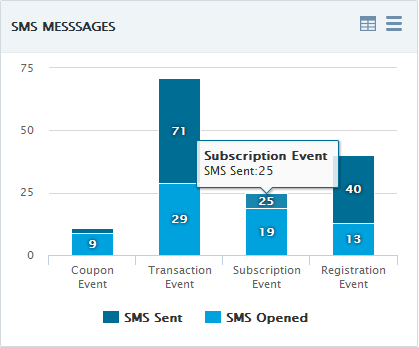
SMS Messages
The SMS Messages Sent versus Opened graph displays the number of SMS sent versus the number of SMS opened for the various events. The default view presents the total number of SMS sent versus opened since Engagement services console is configured and used.
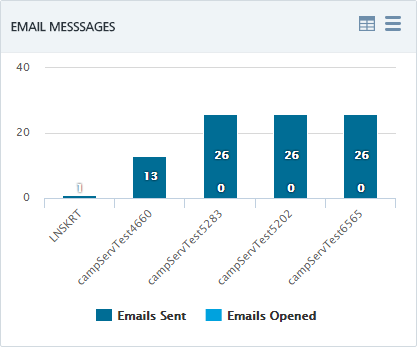
Email Messages
The Email Messages Sent versus Opened graph displays the number of emails sent versus emails opened for various events. The default view presents the total number of emails sent versus opened since Engagement services console is configured and used.
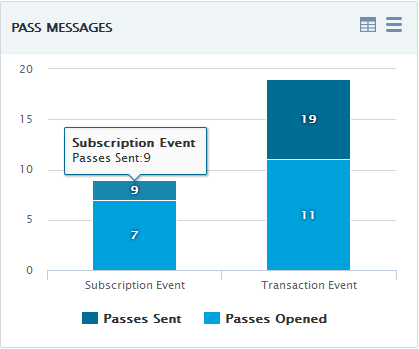
Pass Messages
The Pass Messages Sent versus Opened graph displays the number of passes sent and the number of passes opened for various events. The default view presents the total number of passes sent versus opened since Engagement services console is configured and used.
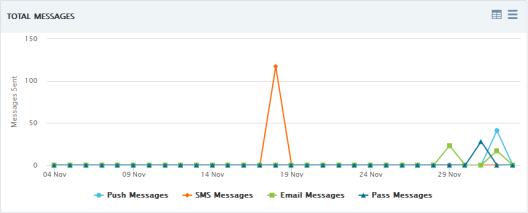
Total Messages
The Total Messages graph displays the total number of messages - push (native and web), SMS, Email, and Pass sent over last 30 days. The Y axis represents the sent messages while the X axis represents the dates on which the messages were sent.
Note: For more details about reports, see Dashboard